Canonical variate analysis (CVA) is a method used to find the shape features that best distinguish among multiple groups of specimens. Group membership is assumed to be known a priori.
CVA is analogous in some ways to discriminant functions and to MANOVA: it looks at the variation among groups in a coordinate system that is modified so that within-group variation is isotropic (Campbell & Atchley 1981; Klingenberg & Monteiro 2005). The corresponding computations involve the inverse of the within-group covariance matrix or, especially in the context of geometric morphometrics, a generalized inverse of the within-group covariance matrix.
CVA is analogous in many ways to MANOVA with the grouping
criterion as the only factor. Accordingly, many of the standard
statistical methods for MANOVA also apply for CVA. MorphoJ uses
permutation tests with two alternative test statistics: Goodall's
F (implicitly equivalent to the use of Procrustes distance)
and Pillai's trace (taking into account that within-group
variation may be anisotropic, equivalent to using Mahalanobis
distance). The P-values for the tests using the two
types of tests can differ, reflecting anisotropy of the variation
within groups and other factors (e.g. Klingenberg & Monteiro,
2005). Usually, the multivariate test using Pillai's trace is
expected to have greater power, but the test based on Goodall's F
is expected to perform better when sample size is small (more
specifically, when the within-group degrees of freedom are not
substantially exceeding the dimensionality of the data).
MorphoJ uses permutation tests for statistical inference. If the
option for a permutation test is selected, MorphoJ will always
perform an overall test of the group effect against the null
hypothesis that there are no differences in means between any of
the groups (for an example of its application, see Budečević et
al. 2022). In addition, there is the option of performing pairwise
tests between all possible pairs of groups.
Selecting the item "Canonical Variate Analysis" in the Comparison menu brings up the following dialog box:
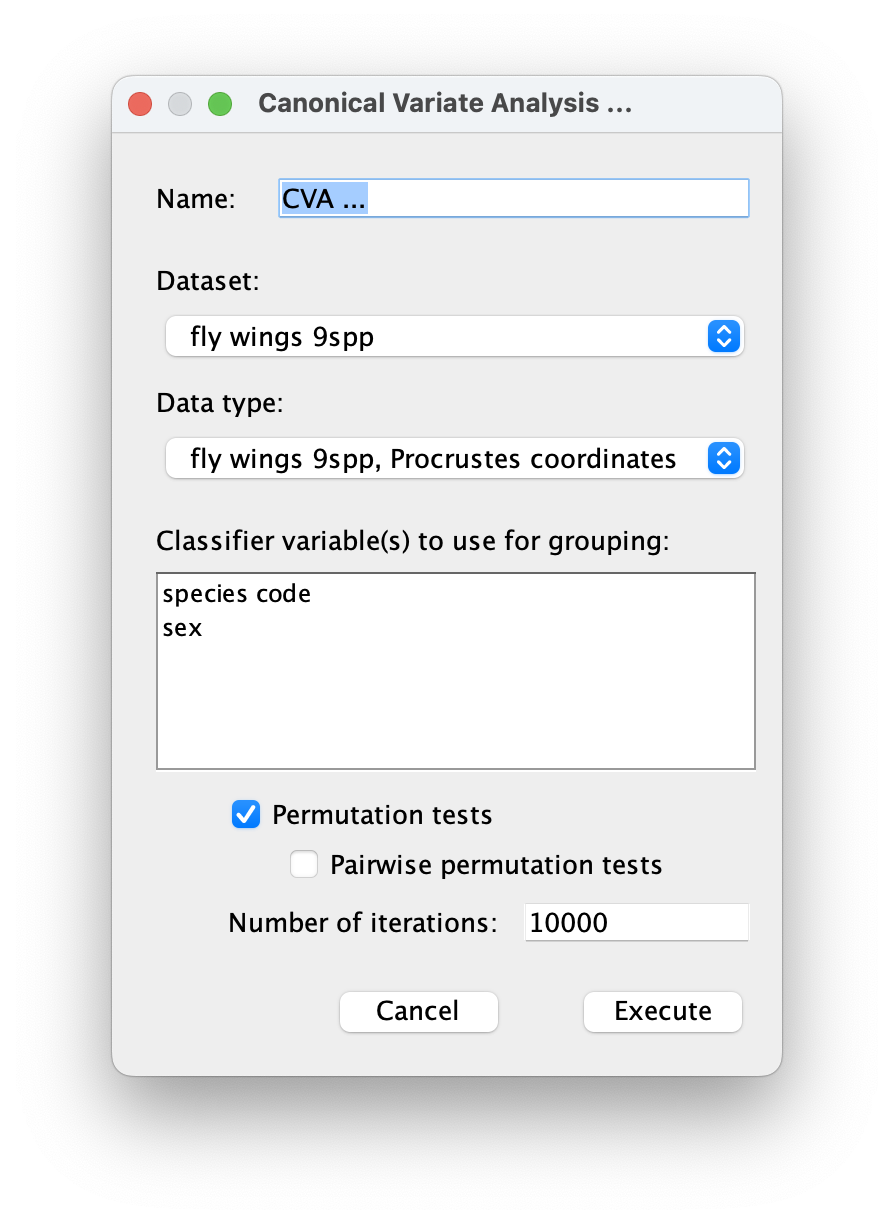
The first element is a text box for entering a name for the CVA that will be visible in the project tree and used in the output.
The second element is a pull-down menu for selecting the dataset for use in the analysis. Once a dataset has been selected, the data types and the classifier variables available in the dataset will appear in the next two elements of the dialog box.
The pull-down menu for the data type lists the type of available data matrices for the dataset.
The window lists the classifiers in the dataset. One or more of them must be selected as the criterion for grouping observations. The values of the classifiers will be used to form groups.
Note that the exact spelling and typography of the values of the classifier matters: for instance, MorphoJ would interpret the values "F", "f" and "female" of a classifier for sex as three different values, and three groups would be formed accordingly. If multiple classifiers are selected, the respective values are linked by a comma and a space. For instance, the linkage of the values "juv." for age and "f" for sex yields "juv., f".
Below the window with the classifiers, there is a check box that can be selected for a permutation test of pairwise distances between the groups.
If the check box is selected, the text field for the number of permutation iterations is activated. The default value is 10,000 iterations per comparison, which is reasonable for most research applications, but can be computationally demanding if there are many groups. For instance, it there are nine groups, 36 pairwise comparisons will be made, which would result in a total of 360,000 comparisons, which can last a while even on a fast computer. This may delay the appearance of the text output in the Results tab.
Clicking the Execute button will start the analysis and remove the dialog box. Output in graphical and text form will appear (see below).
Clicking the Cancel button will stop the sequence, remove the dialog box, and the program will return to its previous state.
The graphical output of the analysis will become visible in the Graphics tab more or less immediately after a CVA is requested by clicking the Execute button in the dialog box. If no permutation test was requested, the text output will also be available quickly, but if permutation tests were requested and there are many groups, it may take a little while until the text output appears in the Results tab.
The graphical output consists of two separate
graphs. One of them shows the shape changes associated with the
canonical variates (CVs). This change is the same as can be
obtained by regression of shape onto the scores for the respective
CV (Rohlf et al. 1996).
The popup menu can be used
to change the CV that is displayed, options such as the scale
factor, the type of graph and the orientation of the shape, or to
export the graph as an SVG file. The scale factor for CV shape
changes is in units of Mahalanobis distance — the shape change per
unit of within-group shape variation; this is the same as the
units of the axes of the scatter plots of CV scores (e.g. the
default of 10.0 is a change of 10 units in the positive direction
along the respective CV axis).
The second graph is a scatter plot of the CV scores. The popup menu for this graph can be used to choose the CVs to be displayed, to color the dots by group membership according to the classifiers in the dataset, to change other options or to export the graph as an SVG file. If there are only two groups, this graph is a histogram instead of a scatter plot. In this case, the popup menu offers somewhat different options; users are encouraged to try out the option "Color by subgroups".
The text output in the Results window provides a range of information including the name of the analysis, the dataset, the classification criterion for forming groups, and the groups and the respective sample sizes.
The next set of entries are the amounts of the variation among groups, scaled for the within-group variation, for which the CVs account. In addition, this information is also presented as a percentage of the total for each CV and as a cumulative percentage.
The following entries are matrices of pairwise Procrustes distances and Mahalanobis distances among all possible pairs of groups. The Mahalanobis distances are given as D values, not D-squared values (i.e., they are interpretable, approximately, as distance measures scaled by the within-group standard deviation in the respective direction). The Mahalanobis distances for all pairs are computed using the pooled within-group covariance matrix for all the groups jointly. This usage reflects the assumption of CVA that the within-group covariance matrices are identical. If users are concerned about this assumption or interested specifically in particular pairs of groups, they should use Discriminant Function analysis, where pairwise Mahalanobis distances are computed just from the pair of groups included in each particular comparison.
If the option for permutation tests has been selected, the
results of the global test of group effects, against the null
hypothesis of no differnces among group averages, are also
displated. These include the Goodall's F and Pillai's
trace as test statistics and the respective P-values from
the permutation test.
If the option for pairwise permutation tests has been selected, the P-values for all the pairwise tests are also presented separately for Pillai's trace and Procrustes distances. By contrast to the Mahalanobis distances, the P-values from the permutation tests using Pillai's trace are based on only the pairs of groups involved in the specific comparisons.
Finally, the output contains the canonical coefficients, which relate the original shape coordinates to the CV scores. These tend to be hard to interpret and may usually be ignored.
Budečević, S., S. Manitašević Jovanović, A. Vuleta, B. Tucić, and C. P. Klingenberg. 2022. Directional asymmetry and direction-giving factors: lessons from flowers with complex symmetry. Evolution & Development 24:92–108.
Campbell, N. A., and W. R. Atchley. 1981. The geometry of canonical variate analysis. Systematic Zoology 30:268–280.
Klingenberg, C. P. & Monteiro, L. R. 2005 Distances and directions in multidimensional shape spaces: implications for morphometric applications. Systematic Biology 54, 678–688.
Rohlf, F.J., Loy, A. & Corti, M. 1996
Morphometric analysis of Old World Talpidae (Mammalia,
Insectivora) unsing partial-warp scores. Systematic Biology 45,
344–362.