Partial least squares (PLS) analysis is widespread in geometric morphometrics (e.g. Rohlf and Corti 2000). It has also been increasingly used for studying patterns of integration of parts within single configurations of landmarks (e.g. Klingenberg and Zaklan 2000; Bookstein et al. 2003; Klingenberg et al. 2003).
MorphoJ offers an implementation of PLS analysis between blocks of landmarks within the same configuration. This analysis identifies the features of shape variation that most strongly covary between the blocks and indicates their relative contribution to the total covariation between blocks.
The computations for PLS analysis within a configuration are the same as for PLS analyses in different contexts. PLS analysis is based on the singular value decomposition of the matrix of covariances between blocks (e.g. Rohlf and Corti 2000).
There is a difference, however, in that statistical tests must take into consideration that the blocks within a configuration are interdependent because of the effects of the Procrustes fit for the entire configuration, in addition to the integration between parts. The implementation of permutation tests for the PLS analysis of subsets of landmarks within a configuration takes this this fact into account by including a Procrustes re-fit as an extra step in each round of the permutation procedure (Klingenberg et al. 2003; Klingenberg 2009). For quantities such as shape asymmetry, which are shape differences (between left and right sides, in the example of asymmetry) rather than shapes, the overall average shape in the sample is added before the Procrustes re-fitting (Klingenberg et al. 2003).
The scaling of the different PLS vectors, one in each block of landmarks, that make up the total shape change for each set of PLS axes is done according to the algorithm outlined by Mitteroecker and Bookstein (2008, appendix). This choice can be justified by a statistical model of complete integration in which the principal components within blocks and PLS axes between blocks coincide.
The RV coefficient (Escoufier 1973; Klingenberg 2009) is used as a measure of overall covariation between blocks. It is a multivariate analogue of the squared correlation coefficient between two variables. Note that the RV coefficient between two sets of landmarks may greatly differ according to whether it is computed from Procrustes coordinates resulting from a simultaneous Procrustes fit of both sets or from separate Procrustes fits of the two sets (as in PLS for two separate blocks). For discussion and worked examples, see Klingenberg (2009). The RV coefficient provided by this procedure is the same as that in the output from tests of modularity hypotheses.
The PLS analysis can be conducted as a pooled within-group analysis. This analysis focuses on the covariation between the deviations from the group averages in the two blocks of variables. Accordingly, the analysis will first remove the differences in the group means, and then run the PLS analysis. The PLS scores for this type of analysis are computed in two ways: group-centered scores, where the group means are removed, and the standard PLS scores computed from the raw Procrustes coordinates, which therefore do include differences in group means. The use of pooled within-group PLS implies the assumption that the covariation between the blocks of variables is the same in the different groups. If this assumption is not met, the pooled within-group PLS can still be interpreted as a compromise between the patterns of covariation in the different groups, but the results need to be interpreted with caution (e.g. groups with bigger sample sizes and groups with greater covariances among blocks will have a disproportionate influence on the PLS analysis).
Currently, only PLS analysis for two blocks is implemented in MorphoJ. It is planned, however, that multi-block PLS will be implemented via the same user interface. (Some of the details of the user interface and output reflect the fact that they are planned to accommodate multiple blocks of variables.)
There are two ways of starting a PLS analysis within a landmark configuration: either from a dataset or from a covariance matrix. If a covariance matrix is derived directly from a dataset, then the analysis from the covariance matrix produces the same result as from the corresponding dataset. The difference is relevant for covariances that have been imported from outside MorphoJ (e.g. genetic covariance matrices).
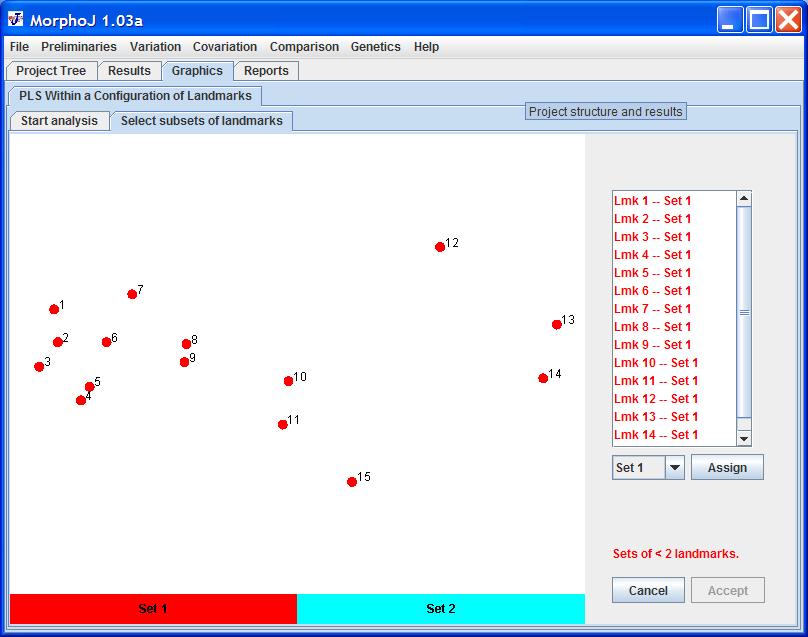
Select the dataset of interest in the Project Tree and then, in the Covariation menu, select Partial Least Squares and then Within a Configuration. A user interface like the following will appear:
This is the user interface to define the sets of landmarks that will be used as the blocks in the PLS analysis. There are three ways of selecting the landmarks for the sets:
The Accept button is deactivated if at least one of the sets has less than two landmarks, and a warning message appears in red print above the Cancel and Accept buttons (see screen shot above). If both sets contain two or more landmarks, this message disappears and the Accept button is activated.
Once the choice of landmarks for each set has been made, click the Accept button. This stores the selection of landmarks and activates the other tab of the user interface ("Start analysis"):

In this user interface, there is a text field for the name of the analysis, which will appear in the Project Tree window.
The drop-down menu for the data type lists all the data matrices in the dataset that can be selected for the PLS analysis. This choice is limited to data types that are shape coordinates, such as Procrustes coordinates and symmetric or asymmetric components of shape or regression residuals, but not other data types such as centroid size, principal component or canonical variate scores, etc.
Below this, there is a check box for requesting a permutation test and a text field for the number of permutation rounds. The default number has been set to 250 permutation rounds; this is less than the number used for other permutation test because the permutation test takes a longer time for PLS within configurations, as a Procrustes fitting procedure is included in each round.
A further option is pooled within-group analysis. If this option is selected, the matrix of covariation for the PLS analysis is computed from the deviations of individual observations from their respective group average shapes. The classifier or classifiers to specify the groups can be selected from the list below the check box.
The panel to the lower left shows the subdivision of landmarks into blocks. If changes to the blocks need to be made, the user should switch to the other tab ("Select subsets of landmarks").
Clicking the Accept button will start the analysis. Clicking the Cancel button will abort the procedure and return to the Project Tree.
The analysis is similar to that from a dataset, except for the fact that some choices have already been made when the covariance matrix was set up (if the covariance matrix is itself derived from a dataset) or are not available (if the covariance matrix is imported from outside the MorphoJ project).
Start by selecting the covariance matrix of interest in the Project Tree and, in the Covariation menu, select Partial Least Squares and then Within a Configuration.
The choice of the sets of landmarks that are to be used as the blocks in the PLS analysis is the same as that described for datasets, and uses the same user interface (see above).
The difference is in the interface used to specify various options for the analysis. For analyses starting from a covariance matrix, a user interface like the following will appear:

The only choice in this interface is whether or not a permutation test is to be performed. This option is only available if the covariance matrix is derived from a dataset.
Clicking the Accept button will start the analysis. Clicking the Cancel button will abort the procedure and return to the Project Tree.
There are several graphs in the output from the PLS analysis within configurations. The first tab contains the graph with the shape changes corresponding to the PLS axes. Note that each of these graphs is composed of multiple components, one per block of landmarks. This multi-part nature of the shape change can be visualized with the option to color the landmarks according to blocks, which can be switched on and off with the pop-up menu of the graph (see screen shot below).

By invoking the pop-up menu in this graph and selecting Copy the blocks of landmarks, the user can copy the division of landmarks into subsets from one analysis to the next (by pasting in the "Select subsets of landmarks" tab, see above). This is useful if there are many landmarks and if the PLS analysis is performed at several levels of variation, e.g. the symmetric component of variation among individuals and fluctuating asymmetry (e.g. Klingenberg and Zaklan 2000; Klingenberg et al. 2003).
The second tab contains a bar chart with the squared singular values as percentages of the sum of squared covariances.
The third tab, only available for PLS analyses from a dataset or from a covariance matrix that is derived from a dataset, contains scatter plots of corresponding PLS scores in the different blocks.
Finally, for pooled within-group PLS analyses only, the last tab contains pairwise plots of corresponding group-centered scores for the different blocks. These scores are computed from the deviations of individuals from the respective group means, so that all groups have averages of zero for these scores. Note that, for pooled within-group analyses, this is the type of covariation that goes into the PLS analysis. Therefore, these scores are useful for visualizing the strength of association between paired PLS axes.
The output in the Results window provides some general information on the PLS analysis, the data it is based on, the landmarks in the different blocks and the options chosen for the analysis. There are tables with the PLS coefficients for each block.
As a measure for the strength of association between blocks, the RV coefficient is provided. The RV coefficient (Escoufier 1973) can be interpreted as a multivariate generalization of the squared correlation coefficient between two variables. Note that the RV coefficient, as it is computed within a single configuration of landmarks, contains some covariation that results from the relative sizes and arrangements of the parts in the joint Procrustes fits (for further discussion, see Klingenberg 2009).
If the option for a permutation test was selected, information of the test and its results follow.
Finally, a table with statistics for each pair of PLS axes: their singular values, the percentages of the total squared covariance for which each squared singular value accounts, and the correlation between PLS scores in the two blocks. If the option for the permutation test was chosen, P-values from the permutation tests are shown for the singular values and the pairwise correlations of PLS scores. All these tests use the null hypothesis of total independence among blocks. Note that the tests concerning individual pairs of PLS axes are often difficult to interpret.
The output dataset contains the PLS scores and, if a pooled within-group PLS analysis was run, the group-centered PLS scores.
Bookstein, F. L., P. Gunz, P. Mitteroecker, H. Prossinger, K. Schaefer, and H. Seidler. 2003. Cranial integration in Homo: singular warps analysis of the midsagittal plane in ontogeny and evolution. Journal of Human Evolution 44:167–187.
Escoufier, Y. 1973. Le traitement des variables vectorielles. Biometrics 29:751–760.
Klingenberg, C. P. 2009. Morphometric integration and modularity in configurations of landmarks: tools for evaluating a-priori hypotheses. Evolution & Development 11:405–421.
Klingenberg, C. P., and S. D. Zaklan. 2000. Morphological integration between developmental compartments in the Drosophila wing. Evolution 54:1273–1285.
Klingenberg, C. P., K. Mebus, and J.-C. Auffray. 2003. Developmental integration in a complex morphological structure: how distinct are the modules in the mouse mandible? Evolution & Development 5:522–531.
Mitteroecker, P., and F. L. Bookstein. 2008. The evolutionary role of modularity and integration in the hominoid cranium. Evolution 62:943–958.
Rohlf, F. J., and M. Corti. 2000. The use of two-block partial least-squares to study covariation in shape. Systematic Biology 49:740–753.