
One of the options for the visualization of shape changes for 2D data in MorphoJ is the presentation as deformed outline drawings. The lines in these drawings are imported from a text file with a special structure. To produce such a file, the user will need an image of the structure of interest, a program for obtaining the coordinates of points on the lines (e.g. ImageJ or tpsDig), and a spreadsheet program (e.g. MS Excel) to assemble the information.
Each drawing consists of a series of lines that are in specific relation to the arrangement of the landmarks. MorphoJ uses the thin-plate spline method to produce a deformation of the drawing so that the arrangement of landmark points matches the configurations that are to be visualized (in the example above, two such defomations were used: one for the average shape shown in light blue and one for the "target" shape shown in dark blue).
A drawing consists of one or more lines (this is the same as in a drawing with pencil and paper). Lines can go through the landmarks or pass around or between them.
The following illustration shows the different lines of one of the outline diagrams in diffrent colors and all the landmarks as black circles.
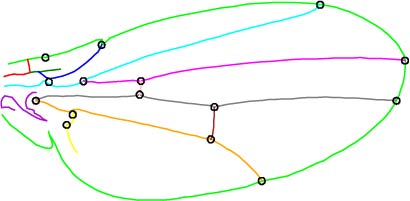
For this diagram, 12 separate lines are needed. In most cases, however, a simpler diagram is sufficient, and even a simple outline contour consisting of just one line may often be sufficient. It is usually helpful to make an actual drawing on paper to decide how many lines to use and how to number them.
The information required for a drawing consists of the landmark coordinates and the coordinates of points on the lines.
This information is included in an outline file in a special structure. The lines are numbered, starting with 1. The landmarks are contained in the file as if they were "line number zero".
The necessary information is read from a text file. It is perhaps best to make this file in a spreadsheet program (e.g. MS Excel), pasting in the coordinate information from a program such as tpsDig or ImageJ.
The file has the following structure:
| 0 | 40150 | 54250 |
| 0 | 40525 | 49641.67 |
| 0 | 37866.67 | 46100 |
| .... | ||
| 0 | 112300 | 48350 |
| 0 | 110100 | 40150 |
| 0 | 81150 | 26400 |
| 1 | 32950 | 53500 |
| 1 | 34600 | 53750 |
| .... | ||
| 1 | 31600 | 43050 |
| 1 | 31000 | 43950 |
| 2 | 32000 | 51200 |
| 2 | 32950 | 51400 |
| .... |
The file has three columns, which must be separated by tab stops, commas or semicolons (the easiest way to do this is to assemble the file in a spreadsheet program such as MS Excel and save it as tab-delimited text). The first column indicates the number of the line segment in the drawing (the landmarks are added first, with a line number 0). The second column contains the x and the third column the y coordinates of the points.
The example above is an excerpt of the example file that was used to generate the drawings of the fly wings in the illustrations above (the lines starting with "...." indicate that lines were omitted at these places). The first three and the last three of the 15 lines for the landmarks are shown (lines starting with "0"). It is critical that the landmarks are listed in the same order as in the data file (otherwise, the graphics may be amusing, but will not be instructive at all).
The last landmark is immediately followed by the first point of line segment no. 1 (first line starting with "1"). As many lines are added in the file as there are points in the line segment, and then the next line segment ist started (switch from lines starting with "1" to those starting with "2"). There is no limit to the number of points in a line or the number of lines in a drawing, but more than several dozen points per line and more than 10-20 line segments will rarely be needed.
The units of the coordinates don't matter as long as all the points, line segments and landmarks alike, are in the same coordinate system (actually, I have no idea what the units for the fly wing example are; I produced it years ago...). Therefore, raw pixel coordinates can be used.
To make the drawings precise, for instance, with respect to the intersection of lines and the location of landmarks, it is often necessary to edit the file by hand.