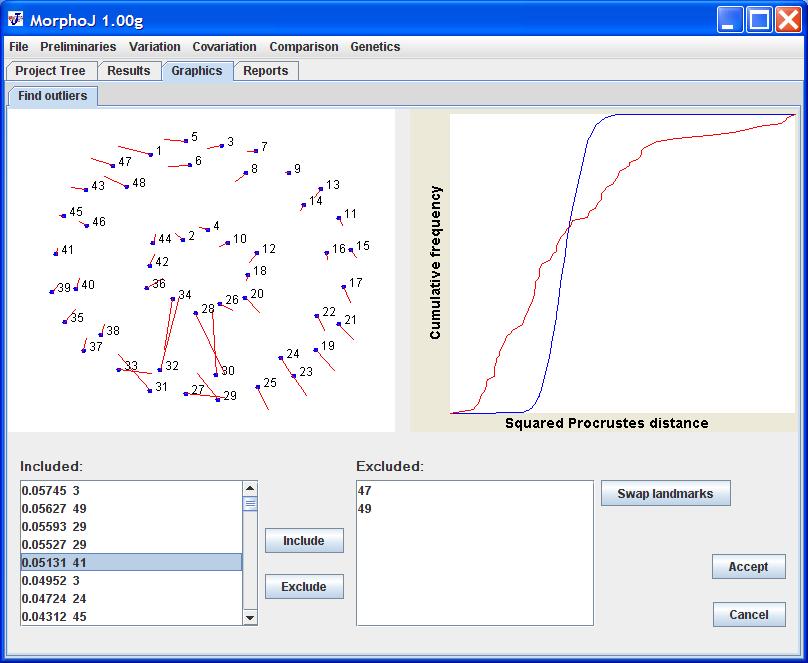
One of the first steps of most analyses is to inspect a new dataset for outliers and possibly rectify any problems in the data. MorphoJ has a specific interface for this purpose. To check for outliers in a dataset, click on it in the Project Tree and then select Find Outliers in the Preliminaries menu.
An interface like the following should then appear in the Graphics tab.
The upper-left panel of the interface contains a diagram showing the average shape as a configuration of blue dots, with red lines that visualize the deviation of the specimen selected in the list "Included:" from the average. By selecting specimens in the list, the user can examine which landmarks deviate strongly from the average shape (in the example shown, landmark 6 deviates most strongly).
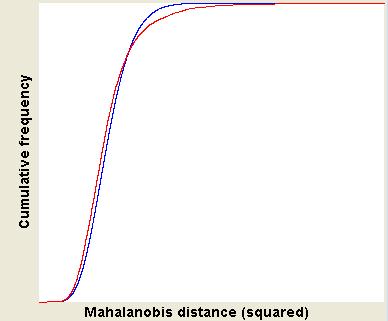
The upper-right panel shows a diagram with the cumulative distribution of the distances of individual specimens from the average shape of the entire sample. The blue curve is the curve expected for a multivariate normal distribution fitted to the data, whereas the red curve is the distribution of distances in the dataset. Depending on the relationship between the dimensionality of the data and the number of specimens in the dataset, either the Procrustes distance or the squared Mahalanobis distance is used (e.g. Klingenberg & Monteiro 2005). Procrustes distance is a measure of the absolute magnitude of the shape deviation, whereas Mahalanobis distance provides an indication of how unusual an individual is relative to the others in the sample (in larger samples).
This diagram should only be taken as an approximate guide to the quality of the data. Users should not expect the data to fit to the multivariate normal distribution, because many morphometric datasets do not conform to that distribution (long-tailed distributions, such as the one shown in the example, are very common). However, users should look out for a pattern such as the following, where the red line is stretched out to the right at the top of the diagram, indicating that there are one or a few specimens that deviate very strongly from the others.
The list entitled "Included:" contains all specimens that are included in the sample, ordered by their distance from the average shape. Each entry consists of the distance and the identifier of the specimen. This is another way to look for specimens that deviate strongly from the average.
If the user decides that a specimen is an outlier and should be excluded from further analyses, this can be done by selecting the specimen (or multiple specimens) in the list "Included:" and clicking the Exclude button. The selected specimens will disappear from the list "Included:" and their identifiers will appear in the list entitled "Excluded:" instead.
The list entitled "Excluded:" contains the identifiers of those specimens that have been excluded from the sample as outliers. Specimens from this list can be included in the sample again by selecting them in the list and clicking the Include button.
Data digitized manually may sometimes show a pattern such as the following, where two landmarks (numbers 23 and 24 in the example) are exchanged:
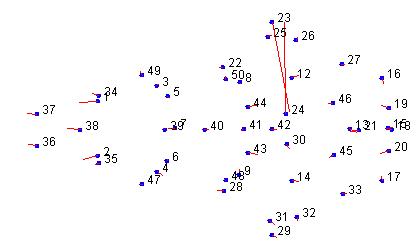
This occurs if the sequence of the landmarks was mixed up in the digitizing process. Sometimes, three or more landmarks may be interchanged. This problem can be corrected by cklicking the button labeled Swap landmarks. After clicking the button, the user will see a dialog box like the following:

Use the two drop-down menus to select the two landmarks and click the Swap button to exchange the two landmarks. When all necessary swaps are done, click the Done button to return to the main interface (this will also update the lists and graphs).
All changes are made in a copy of the dataset until the user clicks the Accept button. If that is done, the specimens that were excluded will be flagged for exclusion in the dataset, and any swapped landmarks will be entered in the raw data stored in the dataset (the corrected set of raw data can be exported by selecting Export Dataset in the File menu). Moreover, a new Procrustes fit for the dataset will be carried out automatically, and any analyses depending on the dataset will be updated.
If the user clicks the Cancel button, the interface will disappear and the dataset will be left in its previous state (with none of the changes preserved).
After the user clicks the Accept button, MorphoJ will update which observations are to be included in or excluded from the dataset. Moreover, the program will also update the analyses that directly depend on the dataset in question. Therefore, the analyses should always be up to date, as far as possible. Any graphical output is updated quickly, if the tabs are open. In contrast, it may take a bit longer for the text output to appear in the Results window. The printing of new text output is triggered automatically, and the sequence of outputs may differ from the original sequence.
The automatic update is only triggered for datasets directly dependent on the dataset for which Find Outliers was invoked. Other branches of the Project Tree are not affected, and therefore analyses such as regression or partial least squares from linked datasets in other branches may no longer be up to date (this is to avoid infinite cycles of mutual calls for updates between linked datasets).
Klingenberg C. P. and L. R. Monteiro. 2005. Distances and directions in multidimensional shape spaces: implications for morphometric applications. Syst. Biol. 54: 678–688