The graphs produced by MorphoJ are set up for manual editing of files to which graphs have been exported (e.g. SVG files that can be used with Illustrator, InkScape or other drawing software). For this reason, different items are colored differently so they can easily be selected to be modified (color, line thickness, etc.) or deleted. While this provides some flexibility, it is also some rather dull and repetitive work to be done before graphs are ready for publication or presentation. To reduce this kind of work and to customize graphs according to the user's requirements and taste, there are some options that can be set and apply to all graphs of a particular type.
The options that can be set concern the color scheme, whether starting configurations are to be drawn as well as the target, the sizes of the points that mark landmark positions, whether landmark numbers are to be displayed, etc. These options differ according to the type of graph (for the different types of graphs, see here).
These options apply to an entire project and are stored with it. For new projects, there are defaults that are the same as the settings in previos versions of MorphoJ.
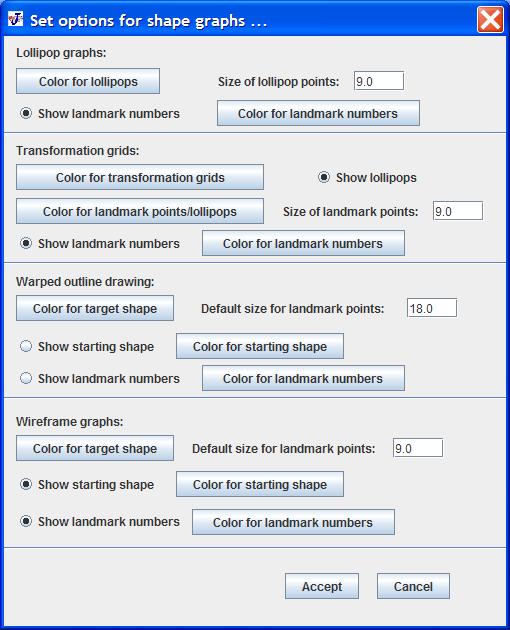
To start, select Set Options for Shape Graphs from the Preliminaries menu. A dialog box like the following will appear:
The options differ according to the type of graph, and are explaied accordingly below. There are buttons that invoke a dialog box for picking colors, radio buttons for switching on and off whether certain components are to be displayed in the graphs, and text fields for entering numbers (for the diameters of points indicating landmark positions).
After manking any changes, the user can click the Accept button to adopt the changes, which then will be stored with the project (i.e. they apply even after a project has been closed and opened again). The Cancel button stops the procedure without saving the changes.
The options apply to all new graphs that are created after clicking the Accept button. The changes do not apply to graphs that are already displayed in the Graphics tab. To apply the changed options to those graphs, change the type of graph (e.g. from a warped outline drawing to a lollipop graph and back) so that MorphoJ needs to create the graph again.
In lollipop graphs, the "lollipops" are the only item that displays the shape change. It is possible to change their color and the diameter of the point that marks the position of a landmark in the starting shape (the "candy" of the lollipop). It is also possible to choose whether the numbers of the landmarks are to be displayed, and the color of those numbers.
These options apply to all new lollipop graphs that is created in the project.
In this type of graph, a shape change is displayed as a deformation of a rectangular grid and either a set of "lollipops" indicating the positions of landmarks in the starting and target shapes or just dots indicating the arrangement of landmarks in the target shape.
The colors of the warped grid and of the lollipops or dots can be selected separately. The diameter of the points indicating the landmarks can also be set bt typing in the text box. Finally, it is also possible to choose whether the numbers of the landmarks are to be displayed, and the color of those numbers.
All these options apply to every new trandformation grid that is created in the project.
The shape change is visualized by the difference between drawings of a starting shape and a target shape.
The colors of the drawings for the starting and target shapes can be selected separately (they should be different from each other). The user can also select whether to display the starting shape at all with the radio button "Show starting shape". For instance, a user may choose to display the shape change along a PC axis as the shapes for the extreme positive and negative scores without the starting shapes (set the scale factor to the corresponding values with the pop-up menu of the graph and, for each value, export the diagram to a graphics file).
The default value for the diameter of the points indicating the landmarks can also be set by typing the value in the text box. This is a default value that only applies to new outline drawings imported into MorphoJ (Import Outline File). The value to be used with each outline in a project is stored with that outline and can be changed with "Resize Landmark Points" in the pop-up menu of any graph that uses that outline drawing.
Finally, it is also possible to choose whether the numbers of the landmarks are to be displayed, and the color of those numbers.
In this type of graph, the shape change is shown by the difference between diagrams of the starting and target shapes, where landmarks are linked by lines to hint at the anatomical context.
The colors for the starting and target shapes can be selected separately. The user can also select whether to display the starting shape at all with the radio button "Show starting shape". For instance, a user may choose to display the shape change along a PC axis as the shapes for the extreme positive and negative scores without the starting shapes (set the scale factor to the corresponding values with the pop-up menu of the graph and, for each value, export the diagram to a graphics file).
The default value for the diameter of the points indicating the landmarks can also be set by typing the value in the text box. This is a default value that only applies to new wireframes created in MorphoJ (Create or Edit Wireframe). The value to be used with each wireframe in a project is stored with that wireframe and can be changed with "Resize Landmark Points" in the pop-up menu of any graph that uses that wireframe.
Finally, it is also possible to choose whether the numbers of the landmarks are to be displayed, and the color of those numbers.